Power BI is a powerful business analytics tool owned by Microsoft. It helps individual users and businesses to generate reports and dashboards effortlessly. By leveraging the platform’s features, users can interpret their data and uncover important insights for enhanced decision-making.
Whether you need to analyze customer demographics, sales figures, or website traffic, Power BI can visualize it appropriately. Yes, there’s a significant difference between discrete and continuous data, but this software is able to use the right tool to display it, ensuring accurate and insightful reporting across all formats.
Power BI Functionality
With Power BI analytical tools, you have access to a robust suite of features that empower you to explore data and share insights. Below are the key features:
- Interactive reports and dashboards: Power BI allows you to generate dashboards and reports using your data to gain real-time insights. You can also visualize complex data using graphs, charts, and tables for easy interpretation.
- Multiple connectors: Supports more than 120 connectors, ensuring easy integration with data from different sources, including databases, cloud services, and marketing analytics tools.
- Data modeling: Power BI’s Data Analysis Expressions (DAX) enables you to conduct complex calculations on your data and discover important trends for enhanced decision-making.
Power BI Data Transfer
Power BI data analysis program offers several data integration options for users. Let’s explore them in detail below:
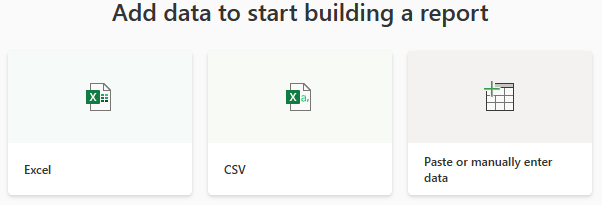
- Import: You can import files from different sources like CSV and Excel into the platform. It’s also possible to paste or manually enter data. Whichever option you use, you are able to analyze data offline and still enjoy faster performance.
- DirectQuery: This involves connecting Power BI to a real-time data source repository and is beneficial for big datasets. The approach ensures seamless integration and accurate insights.
- Live connections: Operates similarly to DirectQuery except that it specifically links to SQL Server Analysis Services without directly querying the underlying data. It also passes the user’s identity for row-level security.
Power BI Reporting
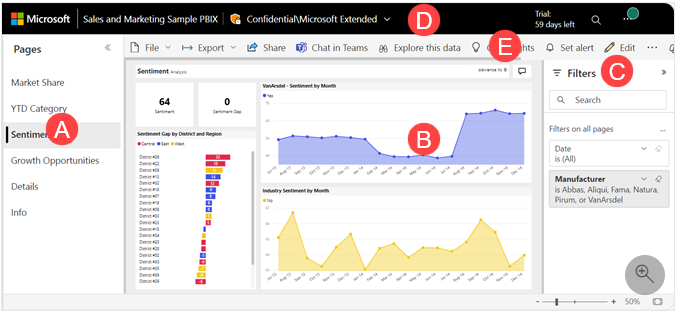
Creating reports, including search engine ranking reports, financial reports, customer analytics reports, etc., by pulling the data from data analysis companies with Power BI is easy and involves these steps:
- Link Power BI to your preferred data sources. Different data collection methods will be used to pull the data to the platform.
- Drag and drop fields onto the report canvas to generate different visualizations (tables, charts, graphs, etc.). You can tailor them by modifying the formatting and settings.
- Apply filters to make it easy to drill down into specific data sections.
- Add titles, adjust the layout, and include colorful themes to make the report more attractive.
- Publish the report and share it with your teams.
Power BI Customer Support
Power BI offers a live chat for direct assistance with a variety of issues, including licensing or technical problems, performance optimization, connectivity, etc. The alternative is to fill out a data collection form to contact the sales team via email and have your questions answered. Check more support options available below:
- Phone: allows you to call agents directly within stipulated hours for assistance.
- Resources: includes articles, tutorials, and documentation to help users familiarize themselves with Power BI.
- Community support: where users ask questions and browse solutions shared by others.
Overall, customer support is satisfactory. The user below acknowledges Power BI’s robust support system, which includes extensive documentation, tutorials, guides, paid support plans, and a vast online community.

Power BI Price Breakdown
Power BI’s pricing packages are flexible mainly designed to meet varying user needs, from individuals to small businesses and large organizations that require big data analytics tools. The plans offer distinctive features and capabilities at friendly prices. It’s even possible to own more than one license at the same time to get the most out of the service.
Power BI Free Trial
Power BI includes a free plan that empowers users to generate rich, interactive reports at zero costs. And unlike other platforms, this option has no time limit; you can use it indefinitely. However, it offers basic report and visualization capabilities. Sharing work or collaboration with other users is also restricted.
Power BI Price Packages
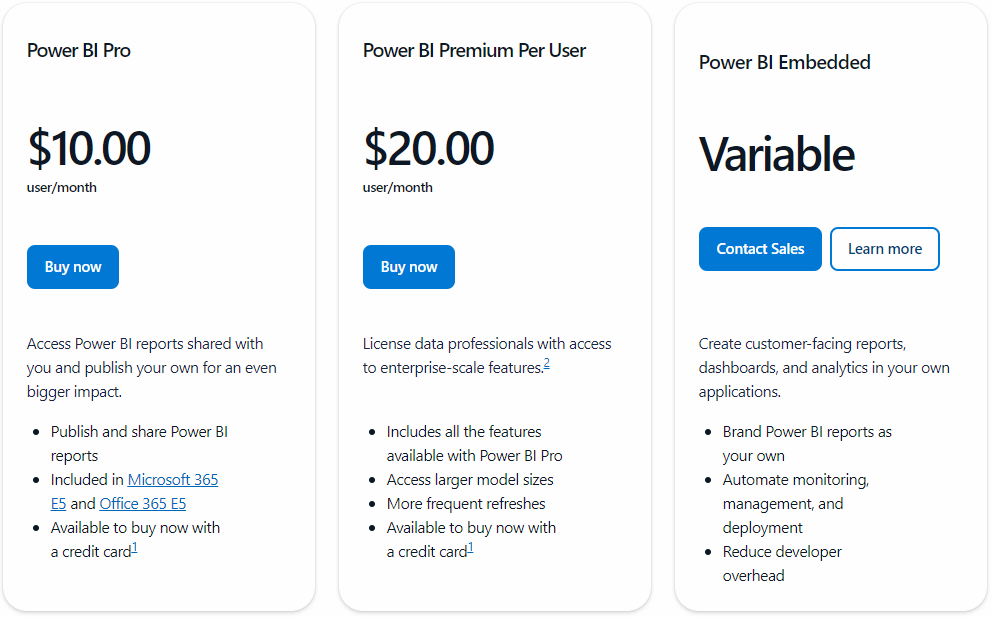
These are the major pricing packages available in Power BI:
- Power BI Pro: Is available at $10 per user per month and is included in Microsoft 365 E5 and Office 365 E5. This license allows you to publish your own reports and share them with others for collaboration. Therefore, Pro is appropriate for teams that need to collaborate on different projects.
- Power BI Premium Per User (PPU): With a price tag of $20 per user per month, this option integrates all features offered by Power BI Pro and more. It provides specialized users like data analysts with access to powerful tools formulated for large-scale, complex data environments. Users also access larger model sizes and more frequent refreshes.
- Power BI Embedded: The price of this package depends on the node type selected and the number of nodes deployed; the cost can start at about $735 to over $23,000/month. With this plan, you can expect improved performance, a bigger storage capacity, and the ability to distribute content without a Pro license. It also minimizes developer overhead, supports branding and automates monitoring, management, and deployment.
Power BI Customer Reviews
Of the thousands of reviews on G2 about Power BI, over half are positive, showing clear user satisfaction with the platform’s capabilities. Below, we showcase some reviews to give you insight into users’ experiences and impressions of Power BI:

As you can see above, the client asserts Power BI offers user-friendly data transformation and cleaning tools along with its powerful data modeling and advanced analytics capabilities.
We have interacted with Power BI and can confirm that the Power Query feature allows you to easily clean, shape, and combine all data types (discrete vs. continuous) without coding. However, we are concerned that data modeling with DAX can have a steep learning curve. Although DAX functions are powerful, they are complex, requiring knowledge of context behavior and syntax, which may be challenging for novices.

In this case, the client is impressed with Power BI’s seamless integration with different data sources, ability to facilitate fast analysis, and ease of creating dashboards for online sharing.
Power BI supports over 1,000 data sources, including databases, cloud services, social media platforms, and more. Creating dashboards is also easy, thanks to the drag & drop functionality. Further, you can share dashboards and reports with others as long you subscribe to a paid plan. It’s important to note that cross-organizational sharing may require extra Power BI licensing or configurations, potentially limiting collaboration with external partners.
Power BI Pros and Cons
| Pros | Cons |
| Intuitive interface: Power BI is intuitive, with features like drag & drop, pre-built templates, and Power Query Editor that make navigation hassle-free | Reliance on Microsoft Ecosystem: Works best with Microsoft products, which may limit users operating in non-Microsoft environments. |
| Extensive customer support: provides multiple support options. | |
| Advanced analytics: features advanced analytics capabilities that help users explore their data deeper for comprehensive insights. | |
| Price-friendly: includes a free trial along with cost-friendly packages for different types of users. |
Verdict
You can trust Power BI to meet your analytics and reporting needs with ease. And the best part? Some of the features, like report creation and visualization, are accessible for free. In case you want to upgrade to a paid plan, it won’t cost you much, especially if you are not a large organization with complex data needs. Moreover, Power BI handles all data formats (continuous vs discrete) from over 1,000 sources, and thanks to its powerful connectors, you can pull data into the platform without coding.





Leave a Reply