What is Klipfolio? Klipfolio is a cloud-based dashboard platform that provides multiple tools to help design custom dashboards and convert data into easy-to-understand reports. The service is offered in two main products: PowerMetrics and Klips.
PowerMetrics caters to data teams and business users in large organizations. It uses the dbt standards in data integrations, and teams need technical expertise to use it. Klips uses the ETL/ELT standards in data integrations, allowing teams to easily pull data from different sources and analyze it on a simple platform. Klips are designed for small to medium-sized businesses (SMEs).
If you want to compare continuous vs discrete data in your analysis, Klipfolio offers a range of visualization tools tailored to each type. It allows you to display discrete data using tables, bar charts, and histograms and showcase continuous data through scatter plots, heat maps, area charts, and more for data-driven decisions.
Klipfolio Functionality
Klipfolio enables you to do the following:
- Data connectivity: The platform easily integrates with 130+ data services, including cloud applications, databases, marketing analytics tools, and spreadsheets. There’s a REST/URL option for connecting unsupported data sources.
- Data modeling: Klipfolio allows you to convert raw data using powerful functions, formulas, and custom calculations to create customizable reports.
- Automated reporting: Klipfolio users can easily create reports or generate search engine ranking reports and share them with your team through a private URL or scheduled email.
Klipfolio Data Transfer
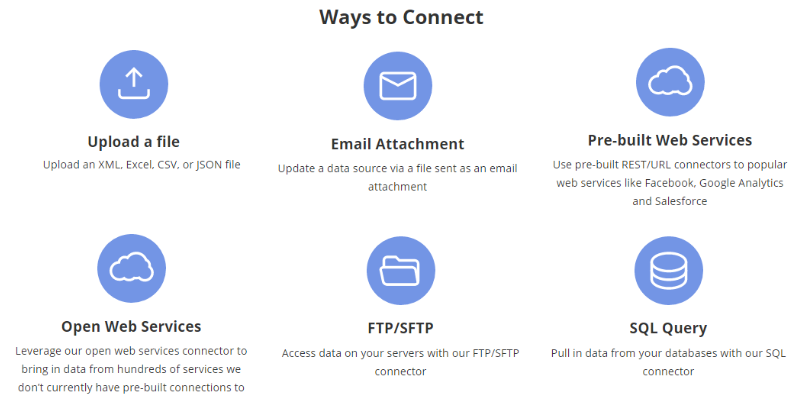
You can send the data you want to Klipfolio, either in the cloud or on-premise. The platform offers multiple data collection methods:
- File uploads or email attachments: Manually upload data files (Excel, XML, CSV, JSON) or update a data source through a file sent as an email attachment.
- Data connectors: There are pre-built connectors that facilitate the integration of data from popular platforms like SQL databases, Google Analytics, Facebook, and HubSpot. Klipfolio doesn’t factor in the difference between discrete and continuous data; it allows you to connect any data type without restriction.
- API integration: This helps integrate data sources not supported by Klipfolio through the REST/URL connector.
- SQL Query: You can connect to an SQL database to run SQL queries and extract data to create a data source.
- FTP/SFTP: The FTP/SFTP connector allows you to access data from your servers to create a data source.
Klipfolio Reporting
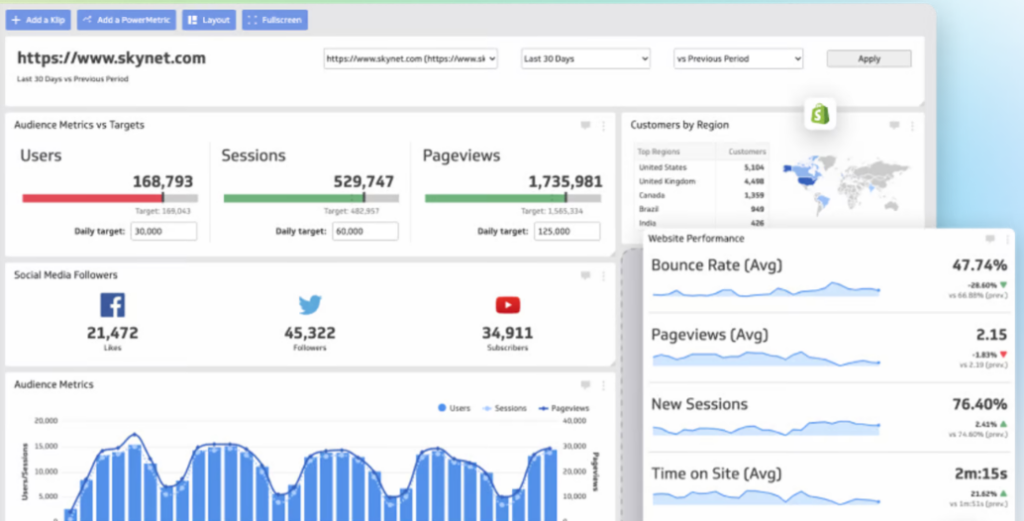
Klipfolio empowers you to generate dashboards and reports based on your data. It offers various widgets (graphs, tables, charts, funnels, pictographs, etc.) so you can visualize data and highlight key metrics. Updates are made automatically at set intervals.
The platform features custom themes to control the overall look of the dashboards. If you want to develop unique visualizations, an HTML template component, inline CSS, and JavaScript are available for that. Klipfolio can visualize complex data through the Klip editor. Using its vast library of functions and formulas, you can filter, aggregate, and group data to derive valuable insights.
Klipfolio Customer Support
The simplest way to contact Klipfolio is through their online help center. It includes a community forum where users can ask questions and learn from each other. There’s also a knowledge base filled with articles that address numerous topics on Klipfolio to keep you informed. Other options are:
- Ticket submission: You just have to fill out the data collection form provided and explain your issue.
- Email: This lets you send detailed inquiries.

Many users are satisfied with Klipfolio customer support services. The team is commended for its ability to solve issues effectively and offer extra help to avoid future mistakes.
Klipfolio Price Breakdown
Klipfolio pricing is flexible and usually based on the usage scale and features provided. The cost incurred also depends on the product chosen. The pricing structure is described in detail in the following sections.
Klipfolio Free Trial
Only Klipfolio PowerMetrics comes with a free trial, which lasts for 30 days—longer than what a typical Klipfolio alternative offers. The premium features are:
- 20 metrics
- 2 users
- Data feed integrations
- Data warehouse integrations
- Semantic layer integrations
- PowerMetrics AI
- Advanced Analysis
- And more…
Klipfolio Price Packages
How much you pay for Klipfolio depends on whether you are on the Klips or PowerMetrics plan. Check how they differ below and the key features and benefits you get:
Klips
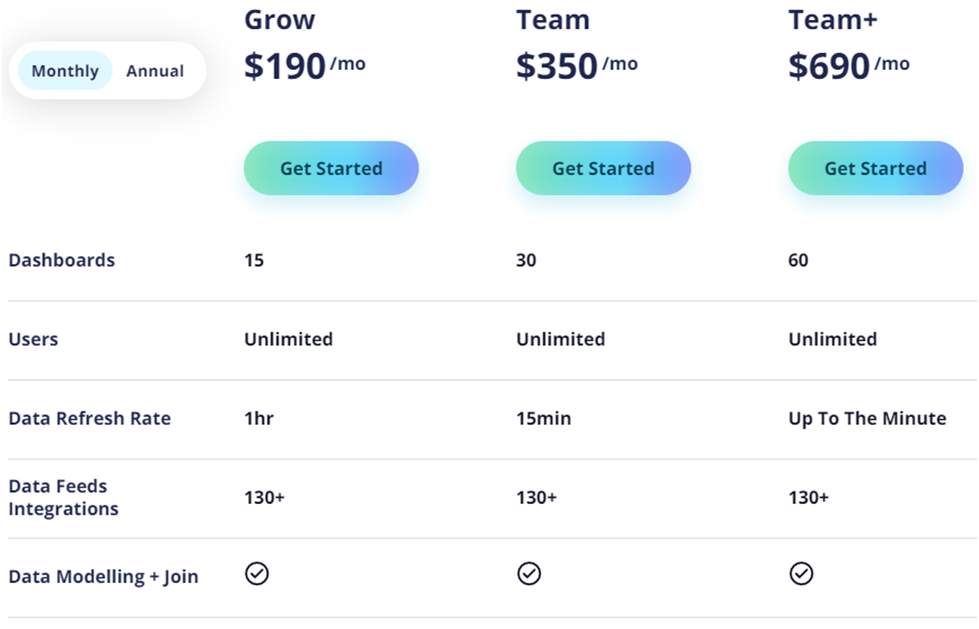
- Grow plan ($190/month): Allows you to only use 15 dashboards and integrated features, although there’s no user limit. You also get hourly data refreshes and access to over 130 data sources.
- Team ($350/month): Increases your dashboard capacity to 30 and provides more timely data refreshes (15-minutes). It offers everything else available in the Grow plan, with additional features like single sign on and warm up refresh.
- Team+ ($690/month): Provides 60 dashboards and up-to-the minute data refreshes. The rest of the features are similar to Team’s, plus priority support and custom onboarding.
Plans for agencies (larger teams) are also available, with prices ranging between $190/month and $1025/month.
PowerMetrics
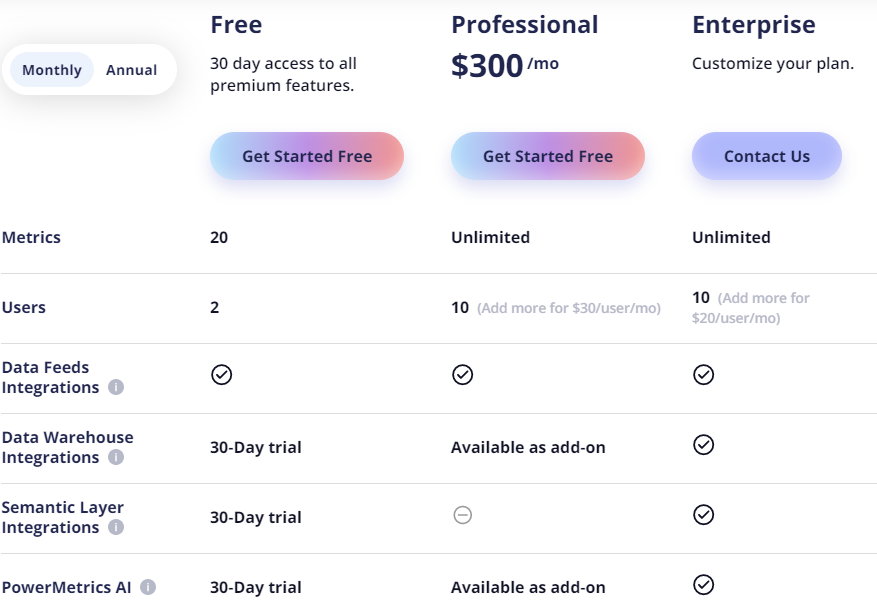
- Professional ($300/month): Supports up to 10 users, with the option to add more for $30/month. There’s no limit to the number of metrics you can use, and data warehouse integrations and Power Metrics AI are provided as add-ons. Other features include advanced analysis, priority support, PDF reports, customizable dashboards, and published views.
- Enterprise (Custom price): Also supports 10 users, with additional users available for $20/month. The rest of the features are the same as the Professional plan, along with Enterprise SSO, service level agreement, custom service agreements, and vendor assessment for bigger organizations.
Klipfolio Customer Reviews
Klipfolio has received hundreds of reviews on G2, most of which are positive. Overall, the tool has a 4.5/5 rating, which is commendable. Let’s explore what some of the users say:
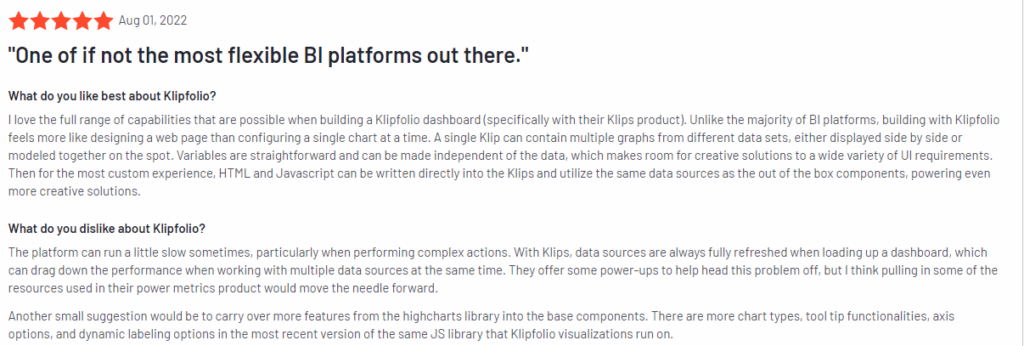
This user loves Klipfolio’s multiple capabilities, including diverse graphs and straightforward variables. They also appreciate the custom experience, as it makes it possible to write HTML and Javascript directly into the platform. These claims are justified. As mentioned earlier, Klipfolio offers numerous widgets for presenting your data and allows you to customize dashboards using HTML, inline CSS, and JavaScript, especially when dealing with complex data. The downside we found is that you may need some technical help to use some of these tools.

According to the user, Klipfolio is easy to use and mentions the drag & drop feature that makes this possible. This feature indeed exists. We liked the drag & drop feature as you can effortlessly configure and arrange components on your dashboards to streamline the design process.
Klipfolio Pros and Cons
| Pros | Cons |
| Multiple visualization options: The platform provides various visualization tools like charts, graphs, pictographs, etc. | Performance issues: You may experience slowdowns, especially when handling big datasets or complex dashboards. |
| Customizability: Allows you to configure dashboards the way you want. | Learning curve: New users may undergo a steep learning curve to navigate advanced and customization features. |
| Wide data integration: Supports hundreds of data sources like Excel, social media platforms, SQL databases and more. | Development time: You may take a long time customizing dashboards to meet your specific needs. |
| Customer support: Provides multiple ways to contact the support team. |
Verdict
Klipfolio really stands out from the competition thanks to its ability to offer a lot of customizability for creating dashboards. It also supports visualization of discrete vs continuous data, enabling you to perform a detailed analysis and customizable reporting based on metrics you want to monitor. With reliable customer support and over 130 data sources to choose from, Klipfolio looks a decent solution for data-driven insights.
If you are new to the platform, the learning curve may be steep at the beginning, but you will get the hang of it with practice and assistance from the company’s professionals.





Leave a Reply